Soft commodities
Wheat, corn and grain markets monitored across the US Corn Belt, Black Sea, Russia, Western Australia, Argentina and EU breadbasket regions.
About Northstar Signal
We turn satellite observations, weather, logistics and location data into early signals for commodities, retail and real estate — measuring the physical economy before it appears in conventional data.
Observe
satellite, weather, logistics and store-level activity
Model
AI pipelines convert noisy physical data into validated signals
Forecast
early indicators for commodities, retail and real estate decisions
How our intelligence is applied
Like a diversified research mandate, our work spans physical commodity markets and location-based activity — unified by the same data-engineering and modelling discipline.
Wheat, corn and grain markets monitored across the US Corn Belt, Black Sea, Russia, Western Australia, Argentina and EU breadbasket regions.
TTF, Norwegian flows, EU storage, Henry Hub, LNG routing and pipeline export corridors mapped with weather, fundamentals and pricing momentum.
Full overview of every store in Germany, Sweden, Norway and Denmark — with revenue estimates, supply and demand per location, shopping centres, retail parks, e-commerce and cross-border trade mapped from local to national level.
What we monitor
We track physical supply and demand where it actually happens — in growing regions, export corridors, storage hubs and pipeline networks. Satellite, weather, logistics and market data are mapped locally before they are fused into forecast signals.
Natural Earth world map · monitored regions highlighted · other land shown in shadow
Selected region
Iowa, Illinois, Nebraska — yield, planting pace, soil moisture
Data layers in this zone
7
active monitoring regions in global wheat coverage
Retail & real estate
In Germany, Sweden, Norway and Denmark we maintain full overview of every store in the market — with revenue estimates, local supply and demand, shopping centres, retail parks and e-commerce integrated into one complete trade network from the local level to the national economy, including cross-border retail flows.
Natural Earth boundaries · monitored markets highlighted · neighbouring countries shown in shadow
Selected market
Complete mapped retail network — every store, centre and park
Formats covered: Grocery, discount, hypermarket, specialty and regional operators
Mapped in this market
4
countries with complete retail network mapping and revenue estimates
Methodology
Our edge is the combination: many imperfect datasets, each cleaned and mapped carefully, then fused into models that detect movement before headline data catches up.
Flows, storage, weather, satellite observations and local activity mapped into one signal layer per region.
Walk-forward testing, out-of-sample diagnostics, paper-trading logs and explicit risk budgets.
Non-standard datasets linked before they appear in conventional terminals and consensus reports.
What we deliver
Signals that connect physical market activity with decisions investors, operators and asset owners need to make.
Supply-demand forecasts for soft commodities and natural gas with regime filters, confidence bands and paper-trading diagnostics.
A complete mapped trade network across four countries — every store, centre and park with revenue estimates and local supply-demand balance.
Repeatable research products — signal databases, briefings, dashboards and API-ready feeds with full audit trails.
Retail Activity Intelligence
8 July 2026Axfood Case Study
~200 grocery stores · ~70% of Axfood retail sales · Built entirely from satellite observations
Brief date: 8 July 2026 (data refresh) · Original brief: 6 July 2026 · Reference event: Axfood Q2 2026 results, 15 July 2026, 07:00 CET
We develop alternative-data solutions that transform Earth-observation data into independent measures of real-world economic activity.
This report presents a case study from Swedish grocery retail: a satellite-derived activity signal covering Willys and City Gross stores within the Axfood retail estate.
The objective is not to estimate sales directly. Instead, we measure changes in physical customer activity and provide an independent data layer that complements traditional financial reporting.
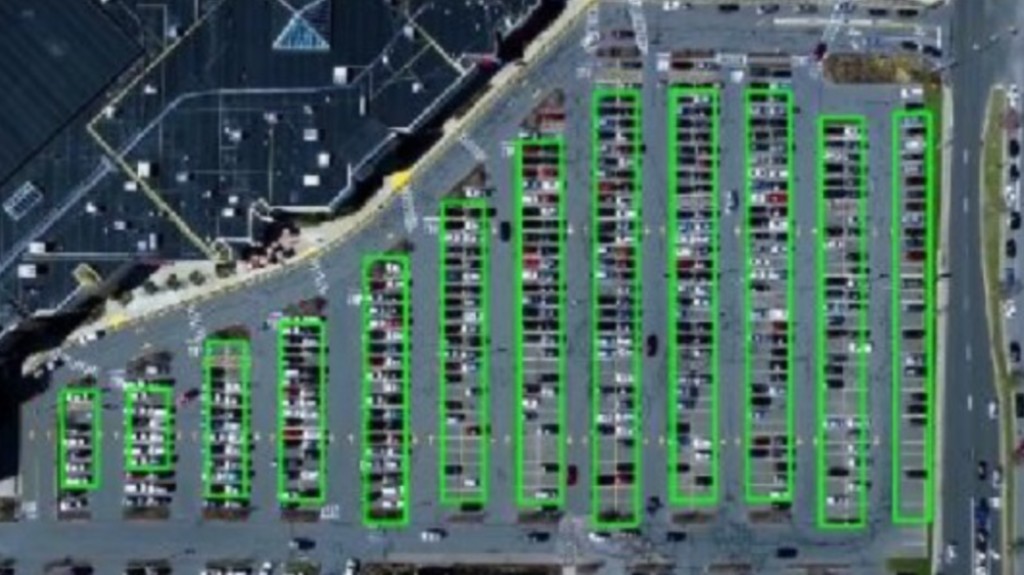
The methodology is built entirely from Sentinel-1 radar imagery, Sentinel-2 optical imagery and high-resolution parking activity detection.
No retailer internal systems, loyalty data, payment-card data, mobile-location data, or consumer panels are used.
The current monitored universe contains 186 validated stores, representing approximately 70% of Axfood's consumer-facing retail sales.
July 2026 data refresh: parking activity was re-measured using validated store boundaries, historical aerial imagery (ortofoto) was recalibrated across 147 locations (the remaining 39 of 186 stores did not take part in this specific refresh—a known, documented subgroup, not a data error), and the activity model was re-run across the full panel.
| Monitored stores | 186 |
| Store Activity Index | 150 stores · quarterly scores |
| Panel history | 2020 Q1 – 2026 Q2 |
| Stores with local competitor benchmark | 39 catchments |
| Validation approach | Out-of-time · within-store baseline |
| Signal type | Directional activity · not a sales forecast |
Financial reporting captures revenue. Satellite observations capture physical activity. These are related—but not identical.
Retail sales can increase because of higher prices, inflation, larger basket sizes and product mix changes, even when customer traffic is unchanged or declining.
Conversely, increasing physical activity may indicate improving customer demand before revenue growth becomes visible.
Where are customers physically going, and how is that changing over time?
Axfood provides an ideal environment for demonstrating the methodology. The company operates several major grocery formats, including Willys, City Gross, Hemköp and Snabbgross.
This initial study focuses on Willys and City Gross because they provide large-format consumer retail locations with observable parking activity.
Coverage includes 186 monitored stores, approximately 80% of eligible locations and approximately 70% of Axfood consumer retail sales. Stores are excluded only when reliable measurement is not possible. No missing stores are estimated.
Each store is measured independently against its own historical baseline. The model combines three satellite-derived observation layers.
Sentinel-1 radar provides frequent observations regardless of cloud cover, darkness and weather conditions.
Sentinel-2 optical imagery provides additional information from surface characteristics and environmental conditions.
High-resolution parking activity detects vehicles from aerial imagery and is used as a direct physical indicator of customer presence. Counts are measured inside validated parking areas for each store—not the surrounding neighbourhood.
The same methodology produces a Store Activity Index (0–100) for every monitored location—designed for operators and asset owners who already control sales data but want an independent traffic layer.
A major challenge in retail analytics is that stores differ significantly. A large hypermarket naturally has more cars than a small urban store.
Therefore, the model does not compare absolute parking counts between locations. Instead, every store is measured against its own historical behaviour.
This removes much of the impact from store size, parking capacity, location and permanent format differences.
Is this store busier or quieter than expected relative to its own normal pattern?
The model was evaluated out-of-time: developed on 2022 Q1 – 2024 Q4, tested on 2025 Q1 – 2026 Q2 without access to future data.
This is not millimetre-level forecasting. The signal is designed to show direction—whether physical activity at a store or across the chain is strengthening or weakening relative to its own history.
Backtests show the activity layer is consistently informative on that question. When traffic moves clearly, the signal and reported sales trends have often pointed the same way—particularly once price-driven periods are understood separately. In flat or inflation-heavy quarters, the two naturally diverge, which is why the product is positioned as an independent activity view rather than a sales substitute.
| Monitored stores | 186 |
| Store Activity Index | 150 stores · quarterly scores |
| Panel history | 2020 Q1 – 2026 Q2 |
| Stores with local competitor benchmark | 39 catchments |
| Validation approach | Out-of-time · within-store baseline |
| Signal type | Directional activity · not a sales forecast |
For retail operators who already control sales and LFL data, the product focus is an independent physical activity layer at store level.
Each monitored location receives a quarterly Activity Index from 0 to 100, measuring whether footfall is rising or falling relative to that store's own history. For stores in competitive catchments, we also report local market share—activity growth versus nearby grocery peers in the same quarter.
The index does not estimate sales. It measures traffic—designed to complement your internal reporting, not replace it.
| Stores scored (0–100) | 150 |
| Store-quarters tracked | 3,007 |
| History | 2020 Q1 – 2026 Q2 |
| Local competitor benchmark | 39 stores |
| What it measures | Footfall momentum vs own history |
| What it does not measure | Revenue, basket size or online sales |
The full index history spans 2020 Q1–2026 Q2, but 2020–2021 has thinner SAR coverage (48 stores); the validated out-of-time holdout window used for model verification (Δρ = 0.327) is 2022 Q1–2026 Q2—do not conflate these two periods in the same read.
| Store | City | Index | Local read |
|---|---|---|---|
| Willys Uppsala Kungsgatan | Uppsala | 83 | Gaining vs peers |
| City Gross Växjö | Växjö | 76 | Gaining vs peers |
| Willys Skövde Stallsiken | Skövde | 70 | Gaining vs peers |
| Willys Sollentuna Häggvik | Sollentuna | 25 | Losing vs peers |
The Store Activity Index is built for operators and asset owners who already hold sales, LFL and pricing data. Our contribution is an independent read on physical traffic—which stores are gaining momentum, which are flat, and which are losing ground against local competitors.
Historical backtests suggest the activity signal has been directionally informative for sales trends, especially when footfall moves clearly and when headline LFL is not dominated by price inflation. It is meant to be read alongside your own numbers—not as a point forecast.
We do not claim millimetre accuracy. We claim a consistent, independent view of where customer activity is heading—store by store, quarter by quarter.
Rank 150 assets quarterly without tenant sales data
Independent footfall trend before negotiations
See which stores gain or lose share in the same catchment
During development, earlier versions produced substantially higher correlations. Additional testing showed that much of this performance was caused by unintended information leakage: calendar variables identified observation years, raw vehicle counts captured store size and image metadata introduced hidden shortcuts.
These effects were removed. After correction, performance decreased but remained statistically significant. We consider this improvement in reliability more important than maximizing headline correlation.
The production model reports only leakage-corrected results.
Ahead of Axfood's Q2 2026 earnings release (15 July 2026, 07:00 CET), the satellite activity signal offers an independent read on physical store behaviour — registered before the report, to be assessed against actual results.
This section presents the full quantitative analysis: the locked chain signal, a full-panel recalculation, an absolute-level comparison against historical Q2 norms, and a satellite-informed LFL estimate incorporating the macro backdrop.
The locked pre-release signal — produced with the same validated pipeline (phase5_replay, within-site Z-score, no calendar features, Δρ = 0.327) — shows relatively flat activity momentum year-on-year.
| Chain-ΔZ (Q2 2026) | −0.080 |
| Observation basis | 46 sites · 76 observations |
| Direction | FLAT (low confidence) |
| Signal locked | 6 July 2026 |
| Pipeline | phase5_replay · within-site Z · no calendar features |
| Validation | Δρ = 0.327 (out-of-time holdout 2022 Q1–2026 Q2) |
Running the same chain-signal logic across the full 150-store quarterly panel (all 766 store-quarter observations) produces a strongly positive YoY reading. This divergence from the locked signal is structural, not a contradiction.
| Full-panel chain-ΔZ | +0.739 |
| Bootstrap CI 95% | [+0.474, +1.009] |
| Stores | 150 · all Willys + City Gross |
| Q2 2025 median sat-YoY | −12.1% (Willys) · −10.9% (City Gross) |
| Q2 2026 median sat-YoY | +5.6% (Willys) · +3.9% (City Gross) |
Interpretation: Q2 2025 was an exceptionally weak comparison quarter (median sat-YoY ~−12%). The strong positive YoY in Q2 2026 is largely a mean-reversion from that trough, not a signal of elevated absolute activity. Three structural factors explain the divergence: (1) the weak Q2 2025 base effect, (2) differences in ortofoto coverage vintages between the two comparison quarters, and (3) partially incomplete Q2 2026 coverage relative to the full panel. Ortofoto recalibration was checked and does not fully resolve the cross-vintage comparison for Q2 2026.
To cut through the base-effect noise, Q2 2026 median predicted car counts were compared against the 3-year Q2 average (2022–2024) — a seasonally matched, source-consistent anchor.
| Q2 2022–2024 avg median cars | baseline (100%) |
| Q2 2026 median cars vs baseline | −4.9% |
| Direction (absolute) | Flat to slightly weak |
| Consistent with locked signal | Yes — chain-ΔZ −0.080 ≈ flat |
Q2 2026 physical activity is approximately 5% below the historical Q2 norm. This aligns with the locked directional signal (FLAT/low confidence). The data does not support a reading of strong volume growth. Physical customer activity remains in line with — or marginally below — multi-year seasonal norms.
Combining the satellite activity signal with CPI and retail indices (SCB food CPI, retail sales indices, synthetic basket proxy panel), five model variants produce the following Q2 2026 Willys LFL estimate. The dominant driver is not volume — it is the food-price deflation reversal.
| Model | Nominal LFL | Real LFL |
|---|---|---|
| CPI only | −5.2% | −0.3% |
| Macro only (CPI + SCB retail) | −5.6% | −0.4% |
| Macro + behaviour (trips/ecom) | −5.6% | +0.2% |
| Satellite + CPI | −5.3% | −0.3% |
| Satellite + macro | −6.1% | −0.7% |
| Average | −5.6% | −0.3% |
Key driver: food CPI swung from +5.3% (Q2 2025) to −6.0% (Q2 2026) — an ~11 pp negative price effect YoY. Customers are visiting at roughly the same rate (real volume ≈ 0%) but paying significantly less per item, compressing nominal LFL. Model MAE is ~1.8 pp; the estimate range is approximately −3.8% to −7.4%.
| Quarter | Food CPI | Willys LFL (actual) | Real LFL |
|---|---|---|---|
| Q2 2023 | +14.5% | +16.4% | +1.7% |
| Q2 2024 | +1.1% | +1.3% | +0.2% |
| Q2 2025 | +5.3% | +8.3% | +2.8% |
| Q2 2026 (est.) | −6.0% | −5 to −6% | ~0% |
City Gross is fully represented in the satellite panel. All 30 stores are tracked across all quarters and included in the chain-level signal calculations. For Q2 2026, City Gross shows the same directional pattern as Willys.
| City Gross stores in satellite panel | 30 |
| CG Q2 2025 median sat-YoY | −10.9% |
| CG Q2 2026 median sat-YoY | +3.9% |
| CG reported LFL Q4 2025 | +1.5% |
| CG reported LFL Q1 2026 | +3.6% |
| LFL backtest model | Calibrated on Willys history (CG: only 2 quarters available) |
City Gross was fully acquired by Axfood in late 2024. Only two quarters of parsable LFL data are available, which is insufficient to train a separate model. The LFL estimate above is therefore calibrated against Willys history. As City Gross LFL history accumulates, a chain-specific model becomes feasible.
Summary — Q2 2026 pre-release view
Physical customer activity is flat to marginally below seasonal norms (−4.9% vs 3-year Q2 baseline). The satellite signal does not support a read of volume growth. Nominal LFL is estimated at −5% to −6%, driven almost entirely by the food-price deflation reversal (CPI: +5.3% → −6.0%). Real volume LFL is approximately zero. City Gross and Willys move in the same direction. To be assessed against Axfood's actual Q2 2026 report on 15 July 2026.
The dataset measures physical activity. It does not directly measure kronor of sales, basket size, profitability or online grocery activity.
Online fulfilment represents a known limitation. Home delivery and click-and-collect generate revenue without necessarily creating parking activity.
This is why the dataset is designed as a complementary information source rather than a replacement for financial reporting.
grocery · home improvement · furniture · electronics · specialty retail
shopping centres · retail parks · commercial property portfolios
independent demand monitoring · portfolio benchmarking · asset screening · operational due diligence
The core principle remains unchanged: measure physical economic activity independently from company-reported data.
Within-store temporal holdout · Training data 2022 Q1–2024 Q4 · Test data 2025 Q1–2026 Q2 · Target variable: within-store activity Z-score · Universe: Willys + City Gross.
The analysis applies chain-level partial pooling, surrogate testing, false-discovery-rate correction, Bonferroni correction and Newey-West HAC adjustments.
| Stores monitored | 186 |
| Eligible stores | ~230 |
| Coverage | ~80% |
| Axfood retail sales represented | ~70% |
| Store Activity Index stores | 150 |
| Stores with local competitor benchmark | 39 |
This Axfood case study demonstrates how satellite observations can provide an independent measurement layer for physical retail activity.
The methodology does not depend on retailer cooperation or internal sales data. It provides a transparent view of where customer activity is increasing or declining, helping investors and operators understand the relationship between physical behaviour and reported financial performance.
The result is a new form of retail intelligence: measuring the physical economy from space.
Request a briefing